Sony Music:
The Pulse
The Pulse
A real time data visualization
to track a major record label's music distribution.
Produced by JSN
Background
Sony Music is one of the 3 remaining major record labels managing hundreds of artists. Every day the company grants and revokes sales rights to distribution partners around the world. Tracking this activity internally was archaic, requiring business users to request custom database reports from internal IT staff. There was a dire need to improve visibility into this process in order to fix problems and identify opportunities to accelerate business. I was contracted by the VP of Sony Music Information Services and Technology (IS&T) to design a visualization app to do just that.
Discover and define
I began by researching the full range and type of activity moving through the label's distribution channels. I pulled database reports showing between 50,000 and 150,000 transactions per hour encompassing a myriad of transaction types and attributes. I documented and validated my findings with a Sony product manager. I gathered a list of additional requirements that included zooming into transactions by product and user-configurable watchlists.
Fig 1: Sifting through a range of reports helped identify the volume and types of data.
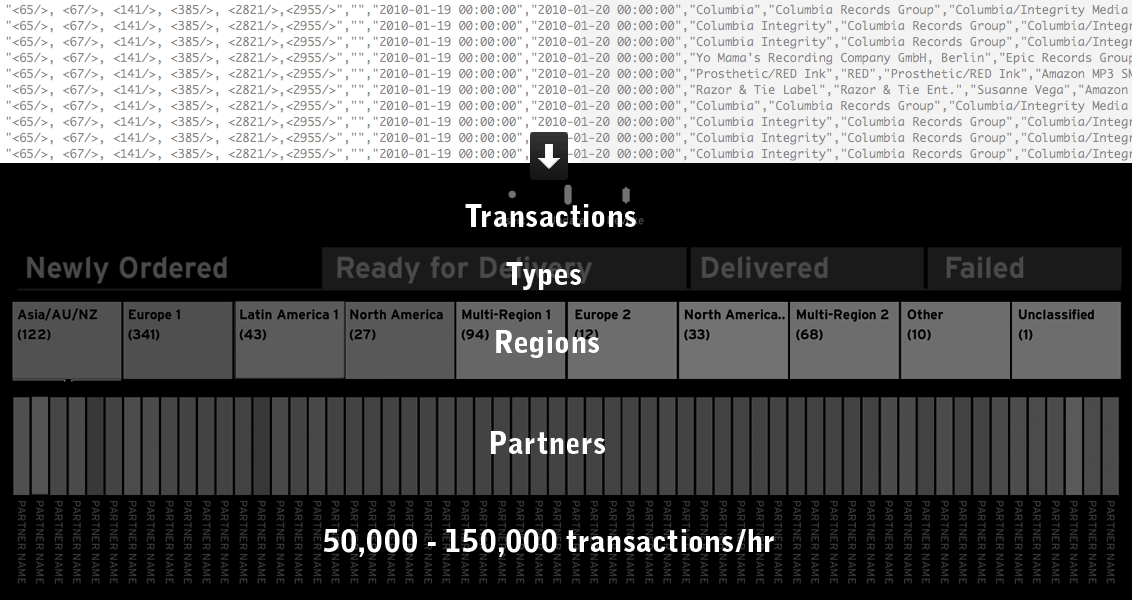
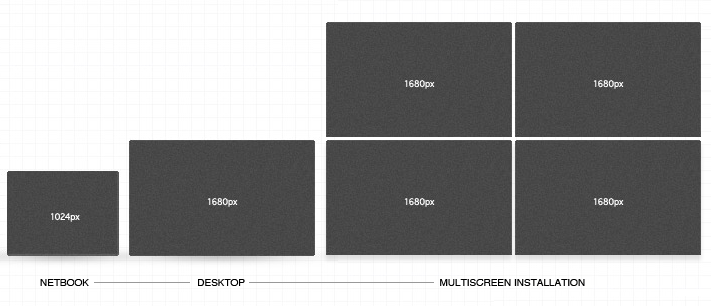
Fig 2: Requirements for the client viewport
Simultaneously, I engaged the technical project manager on a discussion of back-end requirements and visualization libraries.
The new app would need to use the legacy Oracle database without disturbing existing processes. The client would need to be Web-accessible, run 24-7 and display to multiple viewport sizes including a large, multi-screen installation at the company headquarters. Although this desktop app did not need to be functional on mobile devices, I urged consideration for mobile accessibility in future iterations.
Design
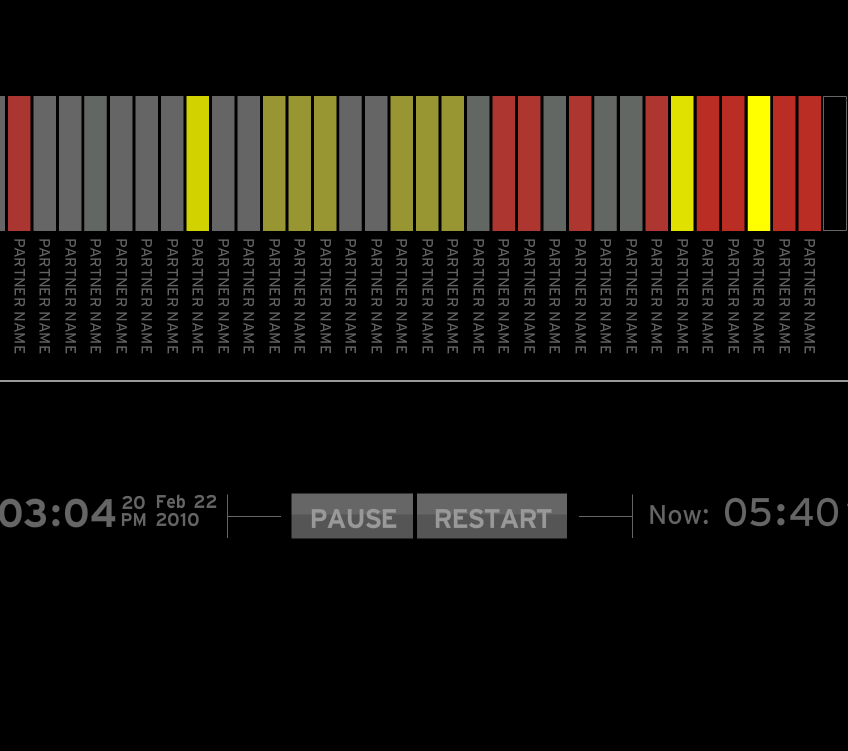
The next step was to produce designs to meet all the requirements. Real time transactions were represented by white symbols falling from above, each with a distinct size and shape to represent transaction type, subtly evoking the metaphor of precipitation. A color spectrum ranging from yellow to red indicated volume. Transactions fell into their appropriate buckets by region and partner. Counters incremented totals for each bucket.
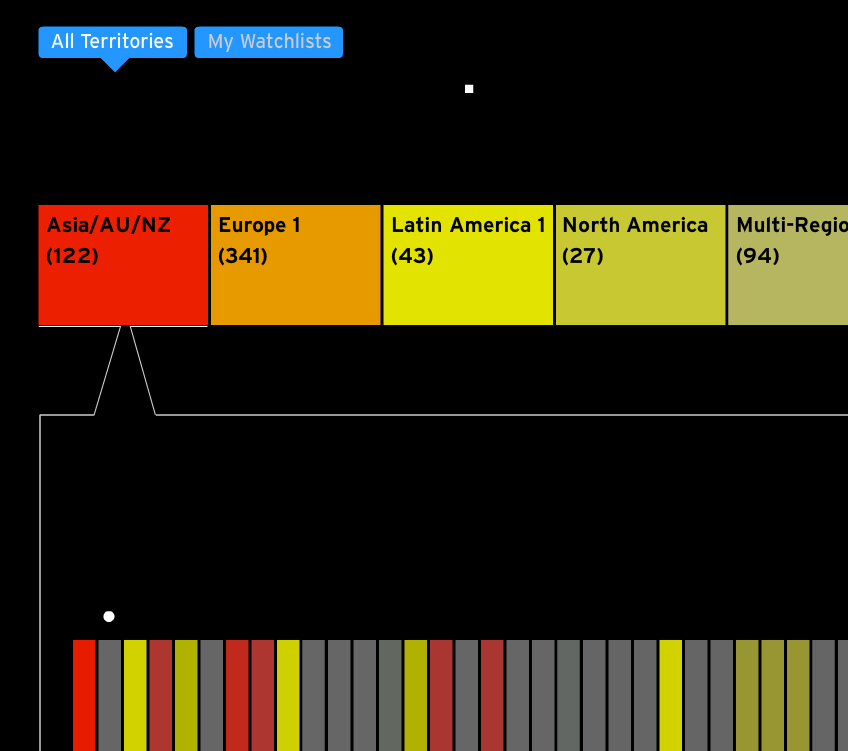
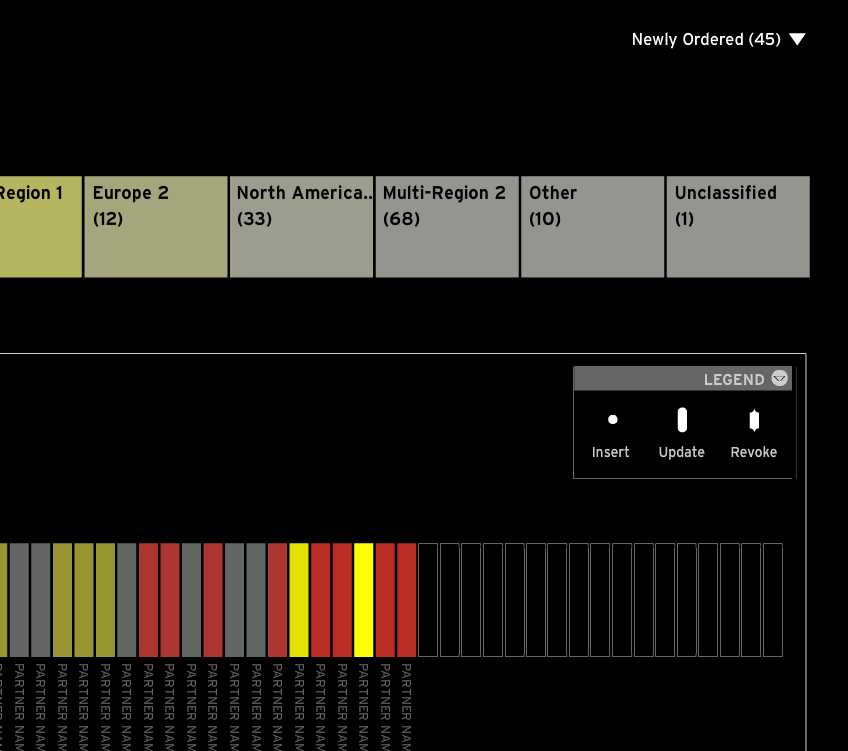
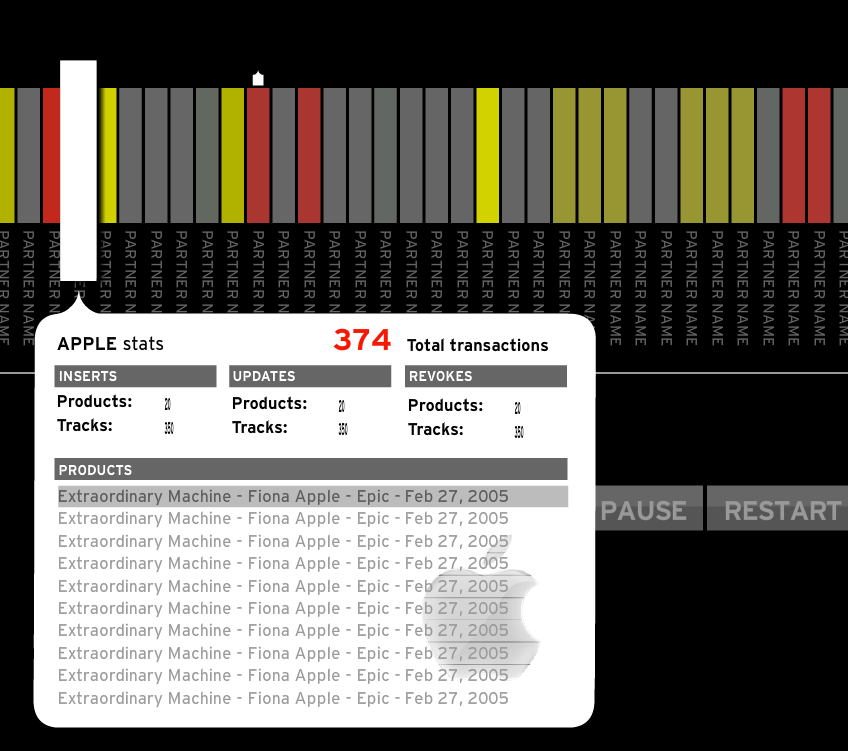
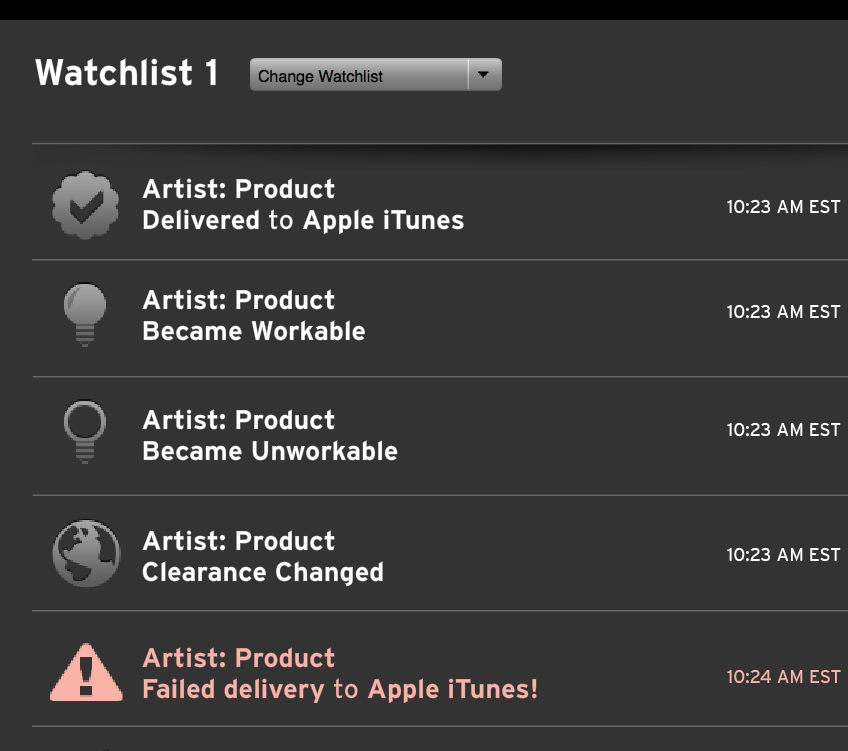
The default view reflected all current activity and provided a breakdown by region. Only two clicks were required to zoom into partner activity (region > partner). Watchlists were created and edited via a modular pane with a search utility to tag specific products. Distinct icons were superimposed on each bucket when transactions for a relevant product occurred. An "events view" displayed details on every transaction in each user watchlist. Finally, all activity could be paused and resumed without loss of data using simple playback controls.
The first designs were wireframes and static graphics representing different states of the application. I presented these as hi-def screens to discuss pros and cons and progress toward a phase 1 product design.
Fig 3: Static designs
Prototype
After soliciting team members' ideas, I developed a prototype to illustrate the look, feel and behavior of the app. It also served as a guide for back-end developers during implementation.
Develop
During implementation, I worked daily and closely with the technical project manager, client developer and database engineer to answer questions, guide, unit test and ensure design specs were adhered to. Early proof-of-concepts and planning helped avoid empty design promises, and on this project every feature proposed was delivered. Working closely with the team built a rapport that helped to design successive iterations.
The Pulse was built into a physical installation displayed 24-7 at Sony's New York City headquarters.
Jason's work here has been outstanding.
—Joe Rinaldi, VP, Sony Music
Credits
Product Designer
Jason Schmidt
VP, Sony Music IS&T
Joe Rinaldi
Technical Project Manager
Chris Mollis
Product Manager
Sheila Eckert
Database Engineer
Tom Haller